
VOSON Dashboard 0.4.2 now available!
We are pleased to announce the most recent development of the VOSON Lab: VOSON Dashboard. The latest release (v 0.4.2) is now available via Github and will be released on CRAN soon.
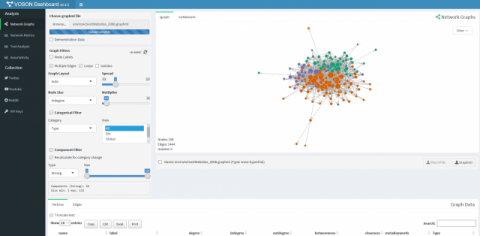
VOSON Dashboard is an interactive R/Shiny application for collecting and analysing networks and associated text data. The app has a dashboard layout with sections for visualising and manipulating network graphs, performing text analysis, displaying network metrics and the collection of network data.
The social media network and text data collection is performed using the vosonSML R package, which provides easy-to-use functions for collecting data across popular platforms (Twitter, YouTube and Reddit) and generating different types of networks for analysis. VOSON Dashboard builds on a number of R packages, in particular igraph (for network analysis).
VOSON Dashboard provides an easy to use interface, to allow users with diverse programming skills to conduct data collection and analysis within the R environment. VOSON Dashbord was designed as a teaching and reserching tool and its development was funded by the ANU Vice-Chancellor's Teaching Enhancement Grant.
Bryan Gertzel is the lead developer and maintainer of VOSON Dashboard, with Robert Ackland also contributing to the software development. Documentation available here.